It’s been a while. I get the feeling that I’m writing to an empty room, which contributes to the lack of content. If this is not the case, please let me know. These are still nice to write sometimes though.
I’ve discovered Minecraft. It’s a sandbox game like no other. The world is a natural landscape generated out of one-meter cubes: hills, mountains, valleys, caves, forests, beaches, deserts, plains, tundra. The fact that’s it’s generated makes it not only different each time, but also incredibly huge: the maximum size of the Minecraft world is limited only by the precision of a 64-bit double. This apparently works out to eight times the surface area of the earth. There’s a lot of exploring to do. However, that’s not all that makes Minecraft different: there’s no goal. There is no objective that the player is pushed to, other than to make their own. I can easily see this being a bad thing for some people, but after playing my fair share of linear games I find it quite refreshing. The player starts out with nothing more than a pair of hands to manipulate the world and works up from there: resources can be gathered to form ever more powerful tools, which can be used to manipulate the world faster. As it’s constructed of blocks, the entire world can be removed block by block, and placed back as seen fit. This allows for the construction of huge castles, tunnels, pits, mines, houses, and highways. There’s a pride in standing inside a shelter built with one’s own virtual hands. I also found Minecraft-Overviewer, which is an application which parses Minecraft maps and renders them into Google Maps tiles so that it can be inspected from above at multiple zoom levels, which sets it apart from single-image renderers such as Cartographer, although Cartographer has many more options. If you’re interested, you can view my world, but I warn that I haven’t built much above ground and it brings the lack of upload bandwidth into sharp focus with its slowness. But it’s there. (EDIT: never mind.) Monsters spawn in the dark: nightfall is terrifying.
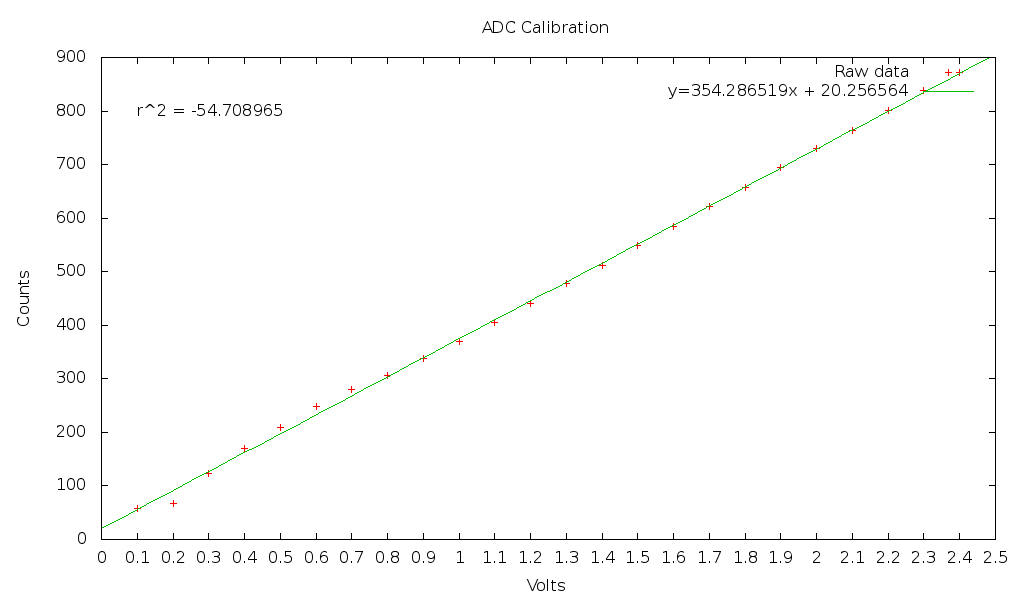
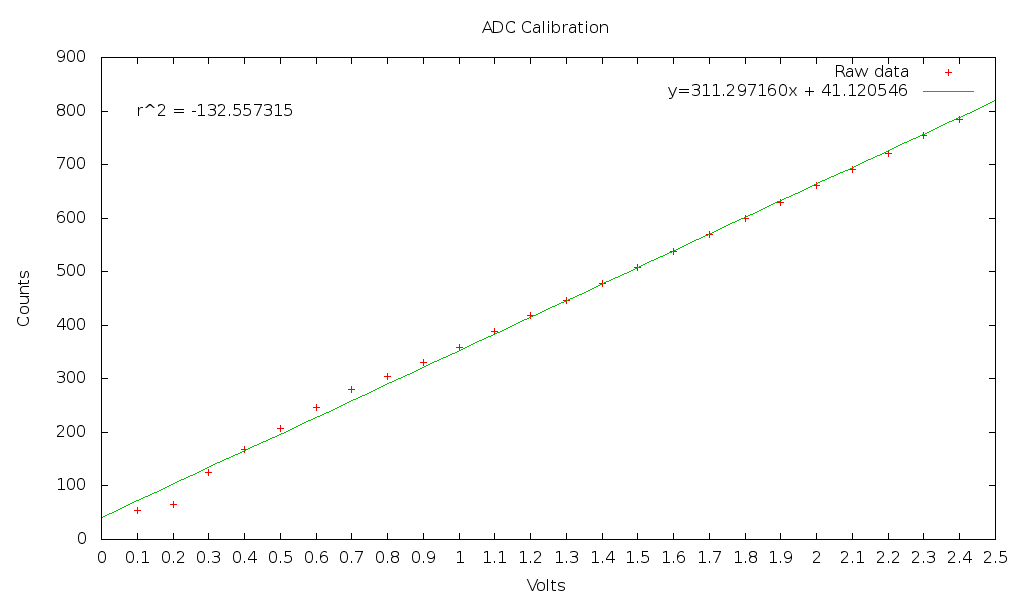
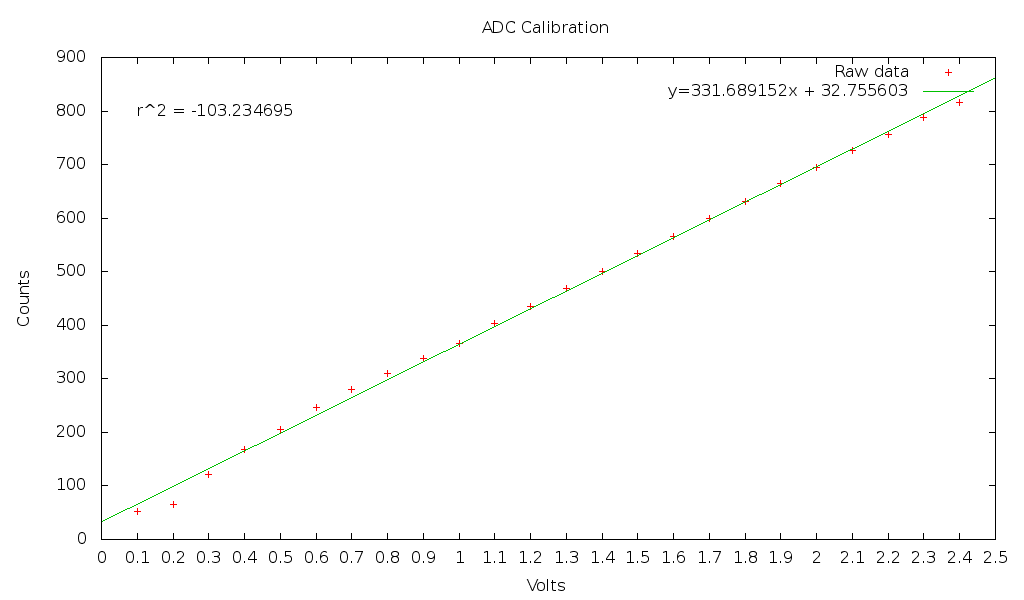
In my engineering course I’m part of a small group that elected to automate a small hovercraft instead of relearn programming concepts we’ve already been over multiple times. Instead of learning more coding, we’re focusing on hardware. Our current status is soldering the chips on a board so that we can attach is to the rate table without it flying apart and eventually mount it on the hovercraft. I spent a few hours with gnuplot_i and GNU Scientific Library to make these graphs. I know the value of R^2 is wrong, I’m not quite sure what it is as I’m having trouble with the statistics functions in GSL and have never taken a statistics course. I hope to get it sorted out soon.


What these show is the data we collected for the channels: we fed it known voltages in 0.1v increments and recorded the count given by the ADC, then found a best fit line for each one. They’re similar, but slightly different: I hope the difference isn’t just sampling error. At the very least they all seem to dip down until around 0.4v and float up until around 1v, so we may need to make something more complicated than a straight line to account for that.
speaking of needing help you should get on xfire or something some time and help me with programming.
Sure, I’d be happy to help.